Playback and Sound Check
Check the frequency response, channel assignment, phase, and dynamic range of the audio system with practical listening tests.
Introduction
In this chapter, the frequency response and connections of the audio system are checked.
Rooms and Loudspeakers
A wide range of compact / desktop loudspeakers is available today. These range from inexpensive, low-to-medium quality drivers that connect to the audio interface or built-in audio output, to high-quality powered monitors designed for nearfield listening. Unlike home hi-fi speakers, these are intended to be heard at close range. Many multimedia speakers also feature magnetic shielding and are “powered,” meaning that a built-in amplifier is provided that allows greater power levels than possible with passive designs.
Standard music sound system speakers and amplifiers work perfectly well for media applications; non-shielded speakers usually only need to be moved out a few inches from a monitor to prevent any effect. The main advantage is that the loudspeakers are of much higher audio quality. With some searching of local sales or online marketplaces, it is possible to assemble high-quality vintage audio gear for the same price as a compact / desktop loudspeaker system. It won’t look as sleek, and will require a lot more wiring and a bit of technical savvy. But the sound is often substantially better. A home system can also be connected with its speakers on either side of the computer monitor. Suffice to say, there’s nothing like hearing the computer’s start-up sound for the first time over large loudspeakers.
Consider a good set of headphones as an alternative to compact / desktop loudspeakers. For around the same price, professional-quality headphones reproduce audio content well and isolate the listener from outside sounds, including the noise of a computer’s fans and drives. Many of the spatial sound examples on this website (especially in Chapter 9) are best heard through headphones.
What follows are strictly informal audio tests, conducted with little or no equipment. Try these tests with different audio interfaces and with different speakers; the results can be dramatically different. Note that these are not really a litmus test for a good versus a bad system, although major problems can be easily identified. Comparisons between two systems are also not completely valid unless the same room, desk and speaker locations are used. Nevertheless, it gives an idea of what is missing compared to everyday listening, in terms of dynamic range and frequency response.
Loudspeaker Placement
A loudspeaker from a desktop / laptop audio system reaches the ear by both a direct path and from early reflections off of the table or other nearby surfaces. The sound is better with the speakers elevated and flush with, or forward of, the front of the monitor.
Figure 8.1 shows the optimal location for the head relative to the loudspeakers (sometimes termed the stereo sweet spot). The center of the head and the loudspeakers should ideally be the same distance from each other, forming an equilateral triangle. Naturally a listener moves about while using a computer, but this position is useful as a reference point for the sound measurements that follow.
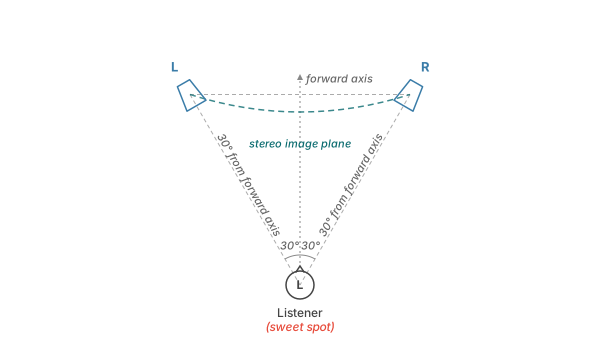
Figure 8.1. The “stereo sweet spot” reference point is referenced to the center of the head, equidistant from the two speakers (black and red squares).
Left-Right Channel Assignment
The first things to determine are 1) whether or not both channels of the system are working; and 2) if the left output of the audio interface is connected to the left speaker, and vice versa.
If both sounds emerge from both speakers, the system probably doesn’t have stereo playback capability, or the left and right channels are shorted together. First check the audio settings in System Preferences or the DAW, and then check the connections between the audio interface and the loudspeakers.
Phase Check
Stereo loudspeakers need to be properly wired in-phase to hear the virtual acoustic imagery properly. The positive and negative signal wiring configuration for each speaker should be identical: the positive (red, +) connections from the amplifier or audio output should be connected to the same positive connector on both left and right speakers; and similarly, the negative (black, –) connections should be consistent between the audio amplifier outputs (or line outputs) and the speakers. In actuality, it doesn’t matter if both speakers are wired in the opposite manner (negative outputs to positive inputs, and vice versa); they’ll still be in relative phase with each other. What matters is if the two speakers are wired differently relative each other. If they are, reverse the leads on one speaker by switching its positive and negative connectors.
Here is an audio test for determining loudspeaker phase:
The in-phase example should create a stable image localized in-between the speakers; the out-of-phase version should sound split between two locations and sound less loud in one speaker. If the opposite occurs, the speakers are wired out-of-phase.
Frequency Response
Determining the frequency response of the system requires a sound pressure level meter (or SPL meter; see Figure 8.2). These devices range widely in price; certain models can cost thousands of dollars. Fortunately, affordable SPL meter apps for smartphones can provide reasonable accuracy for informal tests, and dedicated meters from various manufacturers are available for under fifty dollars. A sound pressure level meter measures the absolute decibel level (see discussion in Chapter 2).
To perform these tests, mount the SPL meter to a stand, with the microphone aimed directly between the computer’s speakers. Place it at the stereo sweet spot location shown previously in Figure 8.1. Try to keep the body from reflecting sound back towards the speakers, or from blocking the sound. Since the level on the meter has to be read immediately after clicking or tapping the appropriate switch, this can be a little tricky at first. For that reason, we’ve added a delay before the test signal begins. Try to minimize the influence of other sound sources in the area (including air ventilation systems).
Different non-linear weightings can be applied to how the SPL meter responds to different frequencies; most common are the “A” and “C” weightings. For these tests, use the “C” weighting. Where different response times are available, choose “slow”; if there is a choice between “peak” and “average,” select average.
What such a measurement captures is the whole playback chain and the room together: the audio interface, any amplification, the loudspeakers, their placement, the listening position, the room itself, and the meter’s own weighting and response time. Below a few hundred hertz the room usually dominates — a null at one position can become a peak a short distance away — so a dip in these readings is not by itself evidence of a fault in the loudspeaker.

Figure 8.2. Sound pressure level meter.
Prepare a piece of graph paper, for each of the test frequencies shown in Figure 8.3 and Figure 8.4. Indicate dB SPL levels on the y axis, from 40–90 dB (increments of 5 dB can be used for an informal test). This graph is for notating the level indicated on the SPL meter, separately for the left and right speakers. Use an “X” for the left speaker and an “O” for the right speaker.
Test procedure: The first task is to get a tolerable 1 kHz reference level that won’t blast the system or the ears. Start with zero volume on the audio system and work the volume gradually upwards on the following examples.
Click or tap the 1 kHz left speaker tone below. Adjust the volume until the SPL meter reads 60–65 dB (reminder: “C” weighting, slow response, average readings). A lower volume level will also serve. This becomes the reference value for the entire test; don’t adjust the volume after this point. Mark it on the graph.
The right speaker 1 kHz value should be very close to the value for the left speaker; if not, adjust the balance control or individual right speaker level (if present) until it equals the left speaker level. Repeat the left signal test if a balance control was adjusted. Without those controls, this difference is a permanent feature.
Test procedure: Now that the reference level is established, proceed by measuring each of the frequencies in Figure 8.3 below. The optimal frequency response would be linear; flat lines even with the 1 kHz value. Non-linearity is to be expected, particularly with inexpensive speakers, along with a lack of low frequency response (especially below 100 Hz).
ISO 1/3-octave centers from 40 Hz to 16 kHz. The 1 kHz row is the reference level (already established above). Play each cell with an SPL meter pointed at the corresponding speaker; the level should be flat across all frequencies (allow for low-bass roll-off below ~100 Hz on consumer speakers).
Figure 8.3. Frequency response sound files for use with SPL meter.
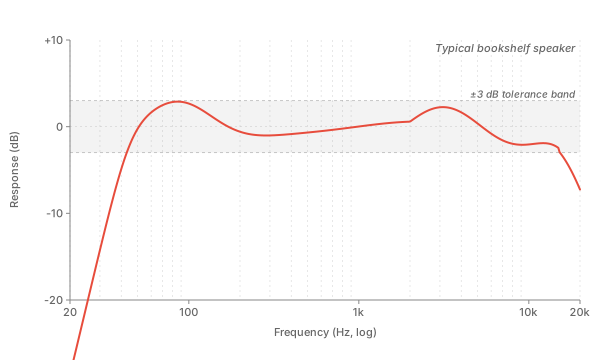
Figure 8.4. An example speaker frequency response plot.
Dynamic Range and Inherent Noise
The following examples are to conduct an informal check of the dynamic range of the system, and the noise floor. Since one probably doesn’t have specialized audio test equipment available, we can use our ears as the test equipment.
In the dynamic range test in Figure 8.5 below, pink noise is used to determine the dynamic range of the system. But it could be that the audio interface or audio system has a high level of inherent noise. Start by first setting the volume control to around the loudest comfortable setting for a sound file such as this one — .
Now, without changing the levels, compare the following sound files, one of which contains 2 seconds of 0s (in other words, total digital silence). One of the buttons does nothing, while the other contains digital noise:
An audible difference indicates the noise floor of the particular audio system in use. What component of the audio system is causing the noise would require a more specialized analysis, where each component is isolated. to find out which one was the “dummy” switch.
Test procedure: In Figure 8.5, pink noise is used as the sound source. Start with a low volume and click or tap the reference button below several times, adjusting the volume up to the loudest comfortable level normally used (without distortion). The examples below bring the level down progressively by 6 dB — each step is half the pressure, and about a quarter of the power. Work downwards while listening, until the sound is inaudible. The attenuation at the last audible step is an informal estimate of the usable range between that comfortable reference and the point where pink noise disappears into the noise floor. It is not a laboratory measurement of the system’s dynamic range: the room, the listening position, and the ambient noise are all in the result.
| Level reduction | Test | Level reduction | Test |
|---|---|---|---|
| 6 dB | 42 dB | ||
| 12 dB | 48 dB | ||
| 18 dB | 54 dB | ||
| 24 dB | 60 dB | ||
| 30 dB | 66 dB | ||
| 36 dB | 72 dB |
Figure 8.5. Pink noise sound files, progressively reduced by 6 dB in intensity.